Thursday, July 30, 2009

Domestiques: Who Needs Them?

In previous posts here and here I looked at some ways to measure the relative value of domestiques. We can also turn this question around and consider which leading riders are most dependent on having certain teammates around to win. Over his career, for instance, has Alessandro Petacchi needed certain lead out men around to win? Have grand tour winners relied on help from specific teammates?

The simplest way I can think to do this is to do a linear regression on the team leader’s results. Linear regression finds the model that best fits all of the leader’s results in terms of a linear combination of parameters from each teammate. These parameters are fit from results data. As usual, I will take the logarithm of all results to put more value on higher placings. Essentially, each result is represented by “adding up” all of the contributions from the teammates that were in that race. This is formally defined for each race as:

Log(R) = β0 + β1 x1 + β2x2 + β3x3

R
is the leader’s result in the race and the xi correspond to each teammate the leader has ever raced with. If teammate 1 was present in the race, x1 is 1. If not, x1 is 0. Writing this equation for every individual race, we get a big series of algebraic equations in which we know all the results and all the xi. We then find the best fit for each of the regression coefficients βi, which correspond to how much each teammate contributes. Helpful teammates will have negative βi since they reduce the result. Teammates with a positive βi tend to make the leader’s results worse.

The coefficient β0, called the intercept, can be thought of as the leader’s base result before teammates get factored in. It is the same for every race, as chosen to best fit all races. A rider with a large intercept relies on specific teammates to bring his result down to a top placing, whereas a rider with an intercept near zero generally does well regardless of which teammates are present. Note that these calculations depend on having a lot of results with a variety of teammates in order to tease out the contributions from each domestique.

I identified 33 riders with at least 15 podiums from Cycling Quotient and performed regression on their career results (excluding ITT and when riding for national teams). Here are the riders, number of races I used in calculations, their intercept, and their most valuable domestique (minimum 50 races together):

The precise value of the intercept isn't very meaningful in itself since I fit log-transformed results, but for reference a value of zero would mean the rider always wins independent of their teammates. So the riders at the top of this list have needed less help to get their results, in the sense that they do well regardless of who they’re racing with. Riders at the bottom are those whose frequency of a good result is dependent on having certain teammates present. Some interesting points:
  • Greipel and McEwen are the sprinters who are high on the list. Greipel has been successful on a team that primarily supports other sprinters – both Cavendish and Henderson have large and positive regression coefficients, meaning they systematically harm Greipel’s results when they’re around. McEwen has made his career winning grand tour stages for teams busy supporting a GC contender. Regression correctly identifies these guys as riders who don’t rely on team support.

  • Similarly, Kirchen and Pellizotti are GC riders who have never had the benefit of a dedicated support team in grand tours. They race relatively independently, as the analysis shows.

  • Recent Astana drama aside, I interpret Contador’s place high on this list to mean he is strong enough to win regardless of who happens to be in the same kit. So we shouldn’t doubt Contador’s grand tour chances in the future, no matter where he ends up in 2009.

  • The riders in the middle (Boonen, Bettini, Menchov, etc.) are all good candidates for guys whose support has depended on age and the specific race. As these riders became more experienced and targeted their races their team support increased, but many of their early results were achieved without a team built around them.

  • Intercepts of 0.6-1.5 are most common, suggesting that it is standard for both GC riders and stage hunters to rely quite a bit on their teammates. This is not surprising.

  • It appears that O’Grady needs specific teammates present in order to do well. I suspect his intercept is so extreme because the majority of his podiums are from grand tours that he has ridden with a core set of teammates, so the regression associates them with his success. This could be coincidence, but we can’t say for sure.

  • Many of the leader-domestique pairings are very sensible. Contador with Paulinho, Petacchi with Velo, and Armstrong with Rubiera are just a few of the well-known combinations that appear on the list.

There are a lot of other ways to judge how much a team leader relies on teammates for success, so I will probably try other methods in the future. Regression, however, is a relatively simple and common way to address problems like this so I decided to start with it.


Technical notes: Data source is Cycling Quotient and includes about 900 races from 2002 to the present. To avoid partial result listings, I considered approximately 900 races in which more than 100 riders are listed in the results. Roughly half of the races were stages from grand tours, and the remaining results are mostly the major one-day races and lesser stage races. Individual time trials and national team events were excluded from the analysis. Regressions were fit using ordinary least squares.


Tuesday, July 28, 2009

Best Domestiques (Podium Edition)

I recently posted a statistical analysis that identified domestiques who are associated with better team results. For example, I found that when Quick Step started Kevin Hulsmans in a race last year, their best finish was an average of 10 places higher than when they did not. So you might say Hulsmans was worth 10 places to his best Quick Step teammate. I also calculated how significant the effects were in terms of the statistical likelihood that such an effect might be a random fluctuation. In doing this, I used log-transformed results to put more weight on better placings. This basically made the difference between 1st and 10th as important as the difference between 10th and 100th. Although this approach is fine for some purposes, I think it still underestimates the importance of a top finish.

This post will propose an alternate method that focuses on podium placings. In a bike race, top 10 results are satisfying only in that they suggest the potential for a 1st, 2nd, or 3rd place finish down the line. So here I will ask if certain riders increase the frequency of their team achieving a podium position. As with the previous analysis I will do this on both a year-by-year and career basis, including races between 2002 and 2009.

As an example, consider Marco Velo. From 2002 to 2008 Velo was a leadout man for Alessandro Petacchi, one of the era's dominant field sprinters, and now performs similar duties on Quick Step. Over that time, Velo has appeared in the results of 281 races, 69 of which have a teammate on the podium (not Velo). His teams also raced 461 times without him, with 57 podiums. So Velo's team has achieved more podiums in far fewer races Velo contested: 69/281 versus 57/461. This corresponds to an odds ratio of 2.3, meaning that it was 2.3 times more likely that Velo's team made the podium when he was in the race. That sounds pretty good, right? But, of course, you also want to know if this a significant difference given these sample sizes. We can use a statistical test to determine that the likelihood of this effect in random data is P = 2e-5, or 0.0002%. Quite significant, suggesting that Marco Velo is an excellent domestique. Good for him.

Using CQ data for all riders (see the riveting technical notes below and on previous posts for more details), I went searching for other extraordinarily valuable domestiques. I identified every rider/year combination with a P less than 0.01. Here are the rider, year, team, odds ratio, P value, and most common teammate on the podium for each significant finding:

The odds ratio is how many times more likely it is that a teammate gets on the podium when the listed rider is racing (larger is better). Infinite results (INF) occur when the team never placed on the podium without the rider present. The P value is the chances that this result might have arisen from random noise (lower is better). I also did the same calculation for each rider's career -- at least using the results I have from 2002-2009:

We can compare these two tables with the previous results and see that there is a fair amount of overlap. For instance, the 2008 season for Kevin Hulsmans is still significant, but now instead of saying he's worth 10 placings we can credit him with a three-fold increase in podium spots. Notably missing is the 2003 incarnation of Andrea Tonti, whom I previously declared to be the best domestique ever. Although his presence corresponded to an astounding gain of 33 placings, he wasn't around for enough teammates' podiums to make this list. So he might be an example of moving teammates into the top 10, but not all the way to the big money.

As before, I'm not implying that a domestique whose specific presence doesn't yield enhanced podium returns isn't doing his job well. He might be on a team that is always putting riders on the podium, or a team with second-rate team leaders who rarely crack the top three. Basically all I'm doing here is identifying domestiques who have shown a pattern of association with good team results. Determining whether the domestique is actually causing the better results is a judgment call that the statistics cannot make.

I prefer this method to my previous one, primarily because it's easier to understand and focuses better on top results. However, this it's bedeviled by some of the same issues. A couple major ones are:
  • False positives. The significance levels appear to be quite low, but since I've done thousands of tests there may be many false positives here. However, I'm not sure how independent these tests are so I can't easily compute a correction. I would have to do a large number of permutation tests to get an empirical idea of the precise false positive rate.

  • Disregarded cofactors. As we all know, correlation does not necessarily imply causation. An analysis like this may be fraught with causal variables that have been ignored in the analysis. For example, it is difficult to separate the contribution of one domestique from another, and from that of the team leader. Many of the riders on the list are Alessandro Petacchi's leadout train (Velo, Ongarato, Tosatto). Were these guys extraordinarily suited to leading out their man, did one of them carry the weight for them all, or were they just lucky to be working for the fastest guy around? It might be impossible to separate the contributions of Petacchi and his leadout train with the results I have, but it's worth thinking about. This analysis doesn't really try. Another cofactor is the nature of specific event. Since pack finishes are so common, domestiques that aid in sprints will have more significant results due to the greater sample size of sprints.

Technical Notes: Data source is Cycling Quotient. To avoid partial result listings, I considered approximately 900 races in which more than 100 riders are listed in the results. Roughly half of the races were stages from grand tours, and the remaining results are mostly the major one-day races and lesser stage races. Individual time trials and national team events were excluded from the analysis. To avoid small sample sizes, odds ratios and P values were only computed if there were five results in every test set. The odds ratio is defined as p_r(1-p_r)/p_nr(1-p_nr), where p_r and p_nr are the frequencies of a team podium place when the rider is and is not in the race, respectively. P values are calculated using Fisher's exact test, which assumes a hypergeometric distribution for the null hypothesis.


Monday, July 27, 2009

UPDATED: Should Unprecedented Tour Success Warrant Suspicion?

Last week I considered whether a big improvement in a rider's results is reasonable grounds for suspicion of doping. Bradley Wiggins is the current poster boy for this sort of skepticism, having just finished fourth in the Tour de France. After last year's Tour, the news that Bernhard Kohl and Stefan Schumacher had been caught using CERA was easy to believe due to the sense that their performances had improved to an extent that wasn't natural.

However, before jumping to conclusions about Wiggins we should ask whether dopers really show significantly improved results and, if so, whether such improvements also occur for non-dopers. This can be answered with some fairly straightforward statistical testing to compare a rider's current results with their previous results. I previously defined two parameters to quantify the improvement and significance of a given rider's results during a given year:
  • R: The difference between a rider’s mean placings in a given year and mean placings in previous years. Larger numbers mean greater improvement.

  • P: The likelihood that this difference is real and not simply a result of random fluctuations (statistical significance). Smaller numbers mean greater significance.
When computing P, I first take the logarithm of all results in order to enhance the value of top placings and minimize differences between mid-pack finishes (e.g. the difference between 2nd and 12th is much more important than the difference between 102th and 112nd). See below for the enthralling technical details.

I computed R and P for 934 riders over the years 2003-2009. For each rider, I only considered years in which 10 or more results were in the Cycling Quotient database. Forty-five rider/year pairings showed statistically significant improvements (see technical note for the definition of "significant"). Here they are, with 2009 cases in red:

Having improved an average of 50 places per race, Wiggins's 2009 is on this list. Columbia's Tony Martin is here as well, and has actually gained more than Wiggins this year. But there are very few convicted dopers here; where are our naughty friends? Adding Di Luca's 2009 to the list I showed on my previous post, the results for recent doping positives look like this:

Although a few of these riders show large gains in average results and fairly low P values, none of these riders appear on the above list of significant cases. So I'd have to say there isn't much support to the idea that a big improvement in results is a sign of doping.


Technical Notes: I defined significance as having a P less than 2e-5. This might sound overly conservative -- it means the chances that the rider's current and previous results are the same is only 0.002%. The problem is that I've done 2400 tests, so a cutoff of 5% would give me over 100 false positives. Dividing 0.05 by the number of tests, I get a P cutoff of 2e-5 and don't need to worry about false positives. Additional technical notes of possible relevance here and here (scroll down to the fine print).

Saturday, July 25, 2009

TdF Stage 20

I think it's fair to say that Armstrong kept his word on what he would do to last year's top 5. Will he now demand that Sastre apologize for making him apologize during the first week? Oh the drama.

Friday, July 24, 2009

Andrea Tonti: Best Domestique Ever?

Now that Mr Lance Armstrong is embracing his role as a domestique (well, sort of), I expect domestiequery to become the hottest trend in cycling chatter. Internet forum people will now get into heated arguments over whether Armstrong is clearly the most awesome domestique ever to ride, or obviously the embodiment of all that is wrong with cycling teamwork.

However, I’m afraid this argument will be even more fruitless than those surrounding the achievements of team leaders. Leaders, after all, win races, which is relatively easy to remember. How often can one recall, much less judge, the efforts of domestiques? Sure, most of us immediately conjure up images of Jens Voigt hammering for his CSC/Saxo leaders, Yaroslav Popovych riding at the limit for Armstrong (but not Cadel Evans), and Johan Van Summeren spending tens of kilometers chasing down breaks for Robbie McEwen. But how essential were those efforts in the end? And, when it comes to grinding out the kilometers, how interchangeable are these guys?

Ultimately I think a good domestique is a rider who makes their teammates better riders. And by better riders, I mean they achieve better results. It doesn’t matter what the domestique does – whether he chuffs out 60 km to chase down the break or takes a fall in the final kilometer to let his man escape, the only criterion is his teammates’ results.

Best of all, a results-based approach enables a quantitative method. First, I take all races that a domestique’s team contested in a given year. At this point, any rider is a potential domestique so I do this for everyone. I then separate this set of races into two groups. The first group is races the domestique finished, and the second are races he did not finish. Ideally this would be based on races the domestique did or didn’t start, but I don’t have that data. I then took the result from each of these races achieved by the best-placed teammate. This gives me two sets of race results, corresponding to the team’s top finisher (other than the rider) in each event the domestique did or did not finish. If the rider’s teammates have significantly better results when he is present, that rider is a particularly valuable domestique.

I calculate two quantities from these two sets of results:

  • D: The difference between the team’s average best placing when the rider is present and the team’s average best placing when the rider is absent. Positive values mean the rider is a good domestique, negative numbers suggest he is not. D is for the domestique value (it’s even the same in French!).

  • P: The likelihood that this difference is real and not simply a result of random fluctuations (statistical significance). Smaller numbers mean greater significance.

Data, as usual, are from the fantastic Cycling Quotient. When computing P, I first took the logarithm of all results in order to enhance the value of top placings and minimize differences between mid-pack finishes (e.g. the difference between 2nd and 12th is much more important than the difference between 102th and 112nd). See below for more enthralling technical notes.

I calculated D and P for riders in the pro peloton over about 900 races from 2001-2009 (see those technical notes again). I computed this on both a year-by-year basis, since certain riders may be better domestiques on certain teams (looking at you, Popo), as well over an entire career (to the extent I have their results). Here are the top domestiques for 2002-2009, using a significance cutoff of 1E-4:

And the prize goes to Italian Andrea Tonti, whose 2003 season was the best performance as a domestique in the data I have. Tonti worked for Gilberto Simoni in his Giro win that season, and presumably when Tonti was not around Saeco did not enjoy the same success. Career performances were led by Sergio Barbero, whose presence in a race was typically worth 24 placings for his team's top finisher. Like Tonti, Barbero had a long career without many wins for himself -- the model domestique. The notables from 2009 thus far are the Milram riders Johannes Frohlinger, Peter Velits, and Fabian Wegmann.

Overall, I was a little surprised at how short this list is. Very few riders, it appears, actually produce a significant improvement in team results. Of course, this is not to say that domestiques don’t earn their pay. Instead I interpret it to mean that domestiques are generally interchangeable, and there are very few riders who have an extraordinary ability to help a team leader.

We can also determine the worst domestiques, riders whose teammates have better results when they’re not around. This isn’t necessarily a bad thing. I interpret these guys as the riders who shoulder the responsibility for winning, and when they’re not around someone else has to step up. Or maybe they’re just bad domestiques. Either way, there are many more significant anti-domestiques than domestiques when the same significance criterion is used:

This riders on this list make a lot of sense to me. Guys like Bettini and Zabel were true team leaders in that when they were in the race, no one else on the team needed worry about getting a result. Incidentally, Bettini was close to making the best domestiques list above for his 2002 season with Mapei, early in his career. GC riders tend not to appear here, possibly because their teammates often finish fairly high on mountain stages and hence the results are always pretty good.

There are some obvious caveats with this analysis. For instance, there might be confounding factors like a domestique that is always paired in races with a very successful teammate (or teammates). This would associate the domestique with the results, even if the leader was independently a great rider. But if that leader rarely rode without this domestique, how would we know his greatness was independent of the domestique? This question is impossible to answer by looking at results alone. As a result of this, domestiques tend to appear in groups (e.g. Lampre in 2003). Furthermore, I only consider a team’s top placing in every race. There may well be domestiques that raise all of their teammates’ results, perhaps through their deft delivery of bottles from the team car.

Technical Details: The data source is Cycling Quotient. To avoid partial result listings, I considered approximately 900 races in which more than 100 riders are listed in the results. Significance was assessed using the Student’s t-test, a way of computing the likelihood that the two sets of race results are different. When performing a t-test for two sets of results, I require that each set has at least five results. Choosing a threshold for significance is a notoriously difficult problem. Naively one would take something like all P less than 0.05, but this implies a false positive every twenty t-tests. Over hundreds of riders this adds up to a lot of spurious positives. The conservative way to deal with this is to divide 0.05 by the number of t-tests (Bonferroni correction), but this assumes all tests are independent and that isn’t the case here. I chose an intermediate cutoff of P less than 0.0001.

Thursday, July 23, 2009

SVD Analysis of the 2006 Tour

As promised, here is more of this dorky, generally pointless stuff – Part 3 of a series on using singular value decomposition to study grand tour results. In this post, I will look at the 2006 Tour de France, a year (in)famous for the Floyd Landis doping spectacle and Oscar Pereiro being declared winner in part due to gaining 30 minutes in a flat-stage breakaway that was not chased. Despite these odd circumstances, the overall complexity of this Tour was less than most grand tours, containing only 3.1 effective stages.

As I discussed in the post on the 2007 tour, SVD basically rearranges all of the results from all of the stages into a series of composite stages, the modes, that appear in the data with decreasing weights. Here are the modes and weights for the 2006 Tour:

The SVD modes are read as columns in the raster plot, with red and green corresponding to greater and lesser times for each stage. Only riders who finished the race are included in the results, and among those excluded is Floyd Landis since his results have been removed from the CQ record.

The first striking feature of the mode patterns is how uneventful the first nine stages were. None of the large SVD modes has a large signal for these stages, meaning very few time gaps occurred. The major climbing stages were Stages 11, 15, 16, and 17, and sure enough these are the primary contributors to Mode 1. Stages 7 and 19 were individual time trials, the first of which had minor effects on the GC. Mode 2 primarily encodes large time losses on Stage 13 – the stage in which Voigt, Pereiro, Chavanel, Quinziato, and Grivko gained enormous time in the peloton. Mode 3 mostly encodes time gains on the Stage 17 to Morzine, which saw the peloton shatter in the wake of Landis’s shady escapade. Modes 4 and 5 are more corrections to mountain stage placings, and the latter modes are minor time gaps on flat stages and time trials.

Each riders’ individual results can be recomputed by summing up these patterns, with each pattern separately weighted according to the individual rider. Looking at the weights for the first two modes for each rider, we see something quite unique in this Tour. This plot shows the extent to which each rider’s results (dot) exhibited Mode 1 (x-axis) and Mode 2 (y-axis), with final GC placing running from red to blue:

Comparing this with the results from the 2007 Tour we see a major rotation such that the results tend to spread from upper left to lower right rather than simply left to right. This, of course, is due to the Stage 13 breakaway. The four points isolate below are Pereiro, Voigt, Chavanel, and Quinziato (Grivko is not included since he did not finish the Tour). Their special status as breakaway survivors is clearly shown in their isolation on the plot. Note that Pererio is to the upper left of his breakaway companions, meaning that his Tour did have the makings for GC success even without the break. Looking at the top 10, we see how he compares to the others:

What are you doing all the way down there, Oscar? Winning the Tour de France, apparently.

TdF Stage 18: The Problem with Greg Lemond

Alberto Contador scored a mighty impressive win in today's ITT. His post-race press conference was clouded by questions about doping, specifically generated by a newspaper column written by Greg Lemond (link is in French). In short, Lemond demands that Contador prove he is clean, otherwise we can only assume he is a doper. The very idea of computing a rider's physiological parameters from TV images is a bit silly, yet Lemond claims a specific VO2 max value for Contador that he considers impossible. When making arguments like this Lemond implicitly assumes arbitrary limits on the capabilities of cyclists, and those limits tend to align with his own performances.

Personally I think Lemond is fine when he talks about the rise of EPO and its effects in the early 90’s. Clearly the EPO users got fast and there was indeed a peloton at two speeds, at least until everyone started using. When Lemond and others bemoan this I think they’re justified, because what they’re talking about is a change in ability across the entire peloton. The average rider got a lot faster, and while technology, training, and team support also improved I don’t think there’s any question that pharmaceuticals were the primary cause.

However, this is much different than looking at the performance of a single rider and calling them dirty, especially if that rider is the best in the peloton. Like everything else, rider ability is spread across a distribution and you can rarely say anything about the extremes of a distribution even if you can characterize the average. By definition, extreme cases like Contador are unlike anyone else in the population. They are literally in a class by themselves, so even if everyone they’re beating is doping it is impossible to know if they are as well (e.g. Armstrong in his prime). Unless they fail a test, of course. One would think that Greg Lemond, himself one of these extreme cases, would recognize this.

If we really did understand physiology to the extent Lemond thinks he does, then we could move past these statistical arguments. But the fact that statistics-based methods (epidemiology, statistical genetics) are still the source of most biomedical knowledge suggests otherwise.

So when Lemond rants about the general use of drugs in cycling he’s got a point, but when he demands that a specific rider justify their results he’s just being a nut.

Wednesday, July 22, 2009

SVD Analysis of the 2007 Tour

I previously posted about using singular value decomposition (SVD) to analyze stage race results and estimated that based on the patterns in the results, grand tours could be reduced to about 3 or 4 stages without losing much information. The character of these “composite stages” depends on the results of each race on a case-by-case basis. Here I consider the 2007 Tour de France, which was the “simplest” tour, effectively having only 2.8 stages.

SVD basically rearranges all of the results from all of the stages into a series of composite stages, the modes, that appear in the data with decreasing weights. The first mode is the most prominent pattern in the data, the second mode the second most prominent, etc, and the weight (aka the singular value) of each mode is that composite stage’s importance in the global data set. The rearrangement can be represented as a raster plot. Here are the modes and weights for the 2007 Tour:

The SVD modes are read as columns in the raster plot, with red and green corresponding to greater and lesser times for each stage.

Looking up the first mode, it is not surprising that Stages 8, 14, 15, and 16 were mountain stages in the 2007 tour. In most grand tours, the mountain stages dominate the major modes because the time gaps in the mountains are so much greater than those in other stages. Mode 1 in particular has an much larger weight than any other mode, and it describes 93% of the results in the Tour. It can be though of as the base pattern for any rider’s results. This first mode alone correctly determines the three riders on the final podium (Contador, Evans, Leipheimer), although it interchanges Evans and Leipheimer’s final placings. It primarily encodes the climbing stages, but also includes some information on the ITTs in Stages 13 and 19. The second mode encodes a correction to the first, which is a time lost in the Alps relative to the Pyrenees, presumably representing riders who grow stronger in the last week. Mode 3 is mostly gains on Stage 9 paired with losses on Stage 15. Modes 4-8 contain further corrections to the mountain stages. Modes 9-14 generally account for time gaps in stages where breaks played a role and details of time trials. Modes 15-21 are slight differences in sprint stage and prologue performances – these weights are extremely small since most of the field finished sprint stages with the same time.

Each riders’ individual results can be recomputed by summing up these patterns, with each pattern separately weighted according to the individual rider. A GC rider, therefore, will have a small weight for Mode 1 since they didn’t lose much time on the decisive stages, whereas a consistent member of the autobus will have a large weight for that mode corresponding to their large time losses in the mountains. We can, for instance, look at the first two modes for each rider. This plot shows the extent to which each rider’s results (dot) exhibited Mode 1 (x-axis) and Mode 2 (y-axis), with final GC placing running from red to blue:

GC riders have lower values for Mode 1 since they lost the least time on important stages. The blob of blue on the far right is the autobus riders who consistently lost a log of time. Zooming in on the top 10 we get an idea of how the GC is scattered:

Contador has the smallest Mode 1 component – he lost the least time in the big stages. Along with his teammates Leipheimer and Popovych, he also did relatively well later in the race, as signified by his large Mode 2 component. Although Leipheimer did well overall (Mode 1), his early losses in the Alps (Mode 2) were not great enough to overcome Evans. We could continue to add modes and represent the data in higher dimensions, but I think two is enough for a blog post.

The 2007 Tour is a fairly typical case for SVD. Most Tours show a similar dominant mode that combines climbing and time trial stages, encompassing most of the GC. It usually takes the addition of one or two more modes to work out the precise order of the podium and a couple more to fill in the details of the top 10, but the majority of activity encoded in the smaller modes are mid-GC reassortments due to breaks.

I think this generally means Tour results can be summarized by a few patterns in the data and therefore major changes in riders’ performances in the course of a grand tour are very rare. This is, however, a global and quantitative view of the data and should be taken as such; the difference between fourth and seventh place for an individual rider is still be quite important to them and their supporters! Vinokourov’s miniscule time gains on the Champs Élysées in 2005 do not appear until Mode 19 in a 2005 SVD analysis, but it certainly mattered to him and Levi Leipheimer.

Next I’ll consider the 2006 Tour de France. How does Oscar Pereiro’s unorthodox victory look through SVD glasses?

TdF Stage 17

The GC activity today was all very exciting, but the ride of the day has to go to Thor Hushovd. Said Thor:

"Today everything just felt perfect. I attacked over the first climb, did a good descent and then had an amazing day in the front," Hushovd said. "I think this is the best day I've ever had on the bike."

This is being played up as a smackdown to Cavendish (as if this bike race was lacking in manufactured histrionics), but I think that distracts from what an awesome ride this was. It is great to see my geeky blogging disrupted by news of manly riding!

The Tour de France has 3.4 Stages

With a time trial and mountain stage remaining in this year’s Tour de France, there are no lack of assurances that the Tour is not over. But once the GC has been sorted out by the early stages, how much do the results actually change? Is there any major variance in the results between each type of stage, or can the Tour be reduced to one representative mountain stage, a representative time trial, and a typical sprint stage?

To determine how complex the Tour is, I calculated the singular value decomposition (SVD) of stage finish times. SVD is a linear algebra technique that rearranges data into a series of features, called modes, weighted from the most important to least important. For example, it is used in image compression to reduce a matrix of pixels to an approximate matrix that is reconstructed from the a handful of modes. Furthermore, by looking at how quickly the mode weights decrease, one can estimate the effective number of independent components in the data. A famous example was a study of correlated voting records in the US Supreme Court, which concluded that the nine justices could be approximated well by 4.7 independent justices with uncorrelated voting patterns. Another way of stating this is that the information content of US Supreme Court decisions is the same as a court of 4.7 justices rather than nine.

Looking at Tour results, we can ask the same question. The Tour is usually 21 stages, but we can perform SVD analysis and determine the effective number of stages. I did this for a number of recent grand tours using results for time lost on each stage from Cycling Quotient. Here are the results:

The average Tour effectively has 3.4 stages, the average Giro 3.3, and the average Vuelta 4.3. The most complex tour here is the 2003 edition, which involved multiple long breaks and a closely contested GC. The Vuelta is consistently more complex than the Tour and Giro, perhaps because breaks are allowed freer reign or riders in the lead are more likely to crack after a long racing season.

So does the SVD analysis reduce the race to a single climbing, time trial, and sprinting stage, with perhaps a “half stage” for hilly transition stages? To fully answer this, we need to look at each stage race on a case-by-case basis. I will look at a few races in forthcoming posts. Briefly, since the consistently good climbers also tend to be the better time trialists, time trials and climbing stages are often combined into a single representative “GC mode”. Additional modes encode variations around this main trend, such as a difference for some riders between the Alps and Pyrenees, and breakaway results. It should be kept in mind that this analysis is entirely data driven – the modes correspond to how the results panned out rather than any preconceived notion of which stages are important in a grand tour. Since I do not have a handy source for complete results during the Indurain years I could not do the analysis, however I imagine the balance of time trialing and climbing might have been different then.


Technical notes: SVD is a linear algebra routine that produces a unique solution for a given data matrix. The results matrix was composed of stages x riders, such that each matrix element is the time lost in seconds for a given rider on a given stage. Time bonuses were not factored in because of personal laziness. Riders who did not finish all stages were excluded since SVD chokes on missing data. The effective number of stages is computed as the Shannon entropy for the fractional singular values squared. Missing grand tours are due to incomplete results in the CQ database.

Tuesday, July 21, 2009

Should Unprecedented Tour Success Warrant Suspicion?

In recent years at the Tour de France we’ve seen breakthrough results from riders like Floyd Landis and Bernhard Kohl nullified by doping convictions. In this light, it is tempting to view the current success of Bradley Wiggins with skepticism (see here for a generally civil discussion). Wiggins, now third on GC, is a multiple gold medalist and world champion on the track, but has never had much success in road or stage racing. He credits his new climbing ability to substantial weight loss paired with a new focus on road racing, but a hardcore skeptic who believes Bernhard Kohl is not going to be so easily convinced.

Of course, at the moment there is no way we can know if Wiggins is on the good juice or not. But we can look at his pattern of improvement and ask how extraordinary it actually is. Similarly, we can look at dopers and determine if their results were entirely unprecedented. To this end, I will consider two quantities:
  • R: The difference between a rider’s mean placings in a given year and mean placings in previous years. Larger numbers mean greater improvement.

  • P: The likelihood that this difference is real and not simply a result of random fluctuations (statistical significance). Smaller numbers mean greater significance.
Data, as usual, are from the indispensable Cycling Quotient. When computing P, I first take the logarithm of all results in order to enhance the value of top placings and minimize differences between mid-pack finishes (e.g. the difference between 2nd and 12th is much more important than the difference between 102th and 112nd). See below for more exciting technical notes.

Here are the career results for Bradley Wiggins:

Wiggins results so far in 2009 are definitely the best of his road career, with a mean placing of 66 compared to 108 over previous years. This corresponds to R = 42.5. The likelihood of this result in random fluctuations is P = 0.00012, suggesting that this is indeed statistically significance. Here is how Wiggins compares to a few other riders:

Sastre’s results appear to have improved slightly, but the P-value tells us this is not significant. Haussler is having a very good season but not to the extent that Wiggins is. Vande Velde was impressive in 2008, but Wiggins has shown an even greater improvement in 2009.

So how rare is this magic season of Bradley Wiggins? Looking back across the CQ data, I identified other riders who have had a season with an improvement greater than or better than Wiggins, defined as a R greater than 42.5 and P less than 0.00012:

Should we be skeptical of Wiggins based on this company? There are a few suspicious characters there, but overall this list is notably light on convicted dopers. We can compare these riders with some of the recent bad boys:

These improvements are generally more modest. Kashechkin, Landis, and Basso are the only riders in this lot whose gains were in the neighborhood of Wiggins's 2009. Three of these riders actually had a drop in results when doping (negative R), although these were not significant.

The data fairly clearly contradict the idea that significant performance improvements are necessarily, or even likely, the result of doping. As always, we should apply the standard caveat that the absence of a positive test does not always imply clean riding. However, without evidence to the contrary I think we should conclude that it is common for riders to significantly improve their performances without the aid of doping. Likewise, it is common for dopers not to have significantly improved results.


Technical notes: Most race results on Cycling Quotient are partial, often listing only the top 10 or 20 riders. For calculation of R and P, only races with 100 or more listed riders were used. Calculations were therefore based on about 900 races from 2000 to 2009, with the later years having more races listed. Roughly half of the races were stages from grand tours, and the remaining results are mostly the major one-day races and lesser stage races. To avoid small sample sizes, R and P were only computed if the rider at hand had more than 10 race results for the year in question and more than 10 results prior to that year. The likelihood P corresponds to the probability that there is no difference between a rider’s mean results in a given year and their mean results in previous years, and was computed using the Student’s t-test without assuming known or equal variances between the two samples.

TdF Stage 16

Well, wasn't that a blast from the past. Nice to see the old man throw down and bridge on a climb like that. He might just hold that second place yet.

Sunday, July 19, 2009

TdF Stage 15

Perhaps it's a little early to call it, but the Tour GC tends to be decided by mountaintop finishes and we've probably seen enough. I think the major remaining questions are if Armstrong and Wiggins can maintain their podium spots on Ventoux.

Armstrong got a lot of grief for a comment regarding the quality of the top finishers in last year's Tour, but after today it looks like he might have had a point. Running down the top 5 from '08:
  1. Sastre is 11th at 3:52,
  2. Evans is 14th at 4:27,
  3. Kohl is flipping burgers in Vienna,
  4. Menchov is 29th at 11:23,
  5. Vande Velde is 12th at 3:59.
I am now waiting for Armstrong to "kick their asses". Team time trials do not count.

Saturday, July 18, 2009

TdF Stage 14

My goodness, who would have ever thought a win by Sergei Ivanov would get everyone so hot and bothered?

Friday, July 17, 2009

TdF Stage 13

I have read that the other racers call Heinrich Haussler "Barbie" for his attention to fashion and grooming. Crying as he won today's stage probably won't help that image, although a 195 km break ahead of the cold, whimpering peloton should earn him some respect. After he took a painful-to-watch second place at Milano-San Remo and another second at De Ronde, today's result isn't a surprise. Looking at Haussler's pro results prior to the start of the Tour shows how he has been steadily marching down the top ten over the past few years:


[Data from CyclingQuotient]

Thursday, July 16, 2009

TdF Stage 12

I've often heard that recovery becomes more difficult with age. If that's true, Lance Armstrong must be pleased with the way the hard stages are spread out in this year's Tour.


I think Nocentini is going to lose his fancy shirt tomorrow.

Wednesday, July 15, 2009

TdF Stage 11

After years of working to chase down breaks for Robbie McEwen, gangly Belgian Johan Van Summeren got himself off the front today. Great to see him on the other side of that situation for once. Unfortunately for him, Columbia-HTC had plenty of help in bringing the race back together for a bunch sprint. There was a rumor that the finishing incline would be difficult for Cavendish, and I guess it was -- he could only beat Farrar by a wheel.


It must be really fun to be Eisel, Grabsch, or any of the other Columbia-HTC riders right now. There are few things more satisfying in cycling than working your ass off for a teammate that has the talent, smarts, and drive to deliver the win.


In
very important news, apparently the UCI leaked to L'Equipe that some unnamed rider thinks Cavendish is an anti-French racist! Cavendish dealt with this matter appropriately:
"For sure I’m going to get arsy at some riders, because, you know, I’m an asshole," said Cavendish. "But it’s irrelevant their nationality, and irrelevant what they look like, or where they come from. Because, like I said, I’m an asshole."
Now Cavendish could have escaped this controversy by pointing out that as a sort-of-British person he is expected to dislike the French, but clearly he has come to the Tour in better form than that. Bravo!

Tuesday, July 14, 2009

Genetics of Athletic Performance (Dog Version)

Dr. Elaine Ostrander is a geneticist at the NIH. She studies genetic variation within and between populations, and tries to identify genetic mutations that cause disease. Her lab studies dog genetics as a model for understanding the genetic structure of populations. Dogs are fairly interesting in this regard because although they are all members of the same species, different breeds show very diverse phenotypes. The size difference between a great dane and a chihuahua, for instance, is far greater than the size difference between any two people. The cause of this size difference is genetic, and the Ostrander lab traced the variation to mutations in the gene IGF-1.

As part of this research program, Ostrander’s lab published a
paper in 2007 on how a genetic mutation in whippets increased their athletic performance. Whippets are lean racing dogs that were bred from greyhounds in the late 1800s and, like amateur bike racers, they compete in categories based on racing ability. Dogs move up and down categories, ranked A to D from fast to slow, as they proceed through their careers.

Not surprisingly, an individual whippet’s physiology has a large effect on their racing ability. In particular, there is a subpopulation called “bully whippets” that show larger than normal musculature. This condition is known as “double muscling” in some breeds of cattle and, in one known case, a human. These individuals have a substantially greater number of skeletal muscle fibers. Furthermore, in bully whippets this enhanced musculature tends to appear at two different degrees – bigger and biggest. To a geneticist, this strongly suggests that the cause is a single genetic mutation that is partially recessive. Dogs with one copy of the mutant gene and one normal gene (heterozygotes) are somewhat more muscular than normal, and dogs with two copies of the mutant gene (homozygotes) are extremely muscular. Following up on this, the Ostrander lab identified a mutation in the myostatin gene (MSTN) as the cause of the bully whippet phenotype. Sure enough, dogs with two mutant copies of MSTN were double muscled, and dogs with a single mutant MSTN had enhanced musculature.


The MSTN mutation had a positive effect on racing ability, judging by the fact that mutant dogs were more likely to be Grade A racers. The MSTN gene was genotyped in 85 individuals and 13 were found to have the mutation. Nine of these 13 were Grade A racers, three were Grade B, and one was Grade D. If this mutation didn’t have an effect on race performance we would expect about 3 mutant dogs in each category; the likelihood we would get 9 or more in Grade A is 0.03%. Although it would be nicer to have more individuals and hence better statistics, this is pretty solid evidence that the MSTN mutation confers an advantage in racing.


This is interesting but not very surprising. Clearly, certain genetic variants are going to improve athletic performance, especially ones that increase muscle mass. One might ask if there are other genetic determinants of racing ability that might explain the 13 Grade A dogs that had a normal MSTN gene. Are they also genetically superior to the other grades, in a way that doesn’t directly involve MSTN?


Indeed, they are. To study this, the researchers genotyped each of the 85 dogs at 32 sites scattered across the genome and then compared the results. Based on this fairly sparse view of the genome (a dog has 39 chromosome pairs, so this is less than one site per chromosome), they computed a representative number they call pc1 for each individual (technically, the first principle component of the genotype). While one individual pc1 isn’t meaningful, we can say that two or more dogs with similar pc1 values are genetically similar. The results looked like this:


The x-axis, pc1, represents the genotype and the y-axis shows the race grade (plus a small random number to scatter the points a little). It is clear that Grade A dogs tend to have low pc1 and Grade D dogs generally have high pc1. Grade B dogs cluster in the middle, and Grade C dogs are spread into a middle and low group. This population structure is partially due to the greater inbreeding within a race grade – fast dogs are bred with other fast dogs, so fast dogs will tend to be genetically similar. It is difficult to tell how great of an effect this has on the current study since the dog’s ancestries were not reported. That caveat aside, the cluster of points in the upper left suggests that the genotypes of the Grade A dogs provide a genetic advantage over the other race grades.

This effect becomes even more clear when we consider only the dogs without the MSTN mutation:


In this second plot points have been faded for dogs with at least one MSTN mutation (bully whippets). We see that all but one of the Grade A dogs with the highest pc1 values carry the mutation, suggesting that this single genetic abnormality has turned these five slower dogs into Grade A racers. Looking only at the dark points, we see strong evidence that MSTN is not the only genetic contributor to racing ability; there are 13 Grade A dogs without the mutation, and all except for a single outlier have a genetic makeup (negative pc1 values) that sets them apart from most dogs in the other grades. The authors suggest that about 70 other genes are contributing to this genetic advantage.

So a major result of this study is a genetic signature for a fast whippet, comprised of 32 markers across the genome. In principle, if one were to give these researchers the DNA from a rookie whippet, they could probably predict to reasonable accuracy whether that dog will be Grade A based on its genotype. The test won’t be perfect, but one might significantly improve the test by including more than 32 genetic markers. Current technology can read millions of genetic markers for a few hundred dollars, so it certainly could be done.


The paper concludes by noting that the MSTN mutation also confers greater musculature in humans, and therefore is a candidate for gene doping. With only one known human case of this mutation it is impossible to predict side effects, rendering this proposition quite dangerous even if it were technically feasible. However, it is probably a matter of time before such ideas will make their way into athletics. Personally I propose an alterative use for genetics in cycling. I would like to collect DNA samples from a few hundred of my fellow amateur racers, genotype them all, and determine the genetic profile of a Cat 1/2, Cat 3, and Cat 4 racer. New racers will be forced to do their ten Cat 5 races, after which they will be genotyped and assigned to their appropriate category. No more unnecessary thrashings of the Cat 3 and 4 fields by clearly superior racers who are amassing upgrade points – just put everyone where they belong and let their training, race smarts, teams, and luck determine the outcome. It will be a new age of bike racing, brought to us by science! Are you reading this, Shawn Farrell?

TdF Stage 10

ASO's plans to liven up le Tour by taking everyone's radios away seems to have backfired. In fact, the race was so boring I suspect we saw a subtle protest at the finish -- Hushovd and Farrar agreed not to try coming around Cavendish so that even the sprint would be tedious. Or maybe they were waiting for their DS to point out the finish line in the last 200 meters. In any case the stage made the rest day press conferences look action packed. Maybe next time assign all riders and DS random radios?


In other, equally exciting news it seems that Giro has their
new lid on a number of teams (Astana, Garmin, etc). Apparently it's very light and weighs not so many grams, but it looks to me like the helmet Postal was wearing in 1999 (maybe now with a Greek name?). I think this will be a marketing challenge for Giro; will the weight savings overcome the dated styling in the eyes of consumers? If my riding cohort is representative of the market, the answer is no. Lightness is fine, but cycling is all about looking good these days. In white, like a bride.

Sunday, July 12, 2009

TdF Stage 9

Egoi Martinez took the mountains jersey today, with Franco Pellizotti 23 points behind. I expected David Moncoutie to make a stronger run for the jersey, but he did enough too keep himself in contention by getting in today's early break and fighting for a few points. Yes, this is a minor matter, but I don't have much more to say about the fairly boring stage today. Whatever happened to that plucky little mountain scamp, Riccardo Ricco? I miss him.


I also missed most of the TV coverage since I was "enjoying" a 40km time trial today. Unfortunately I did just well enough to encourage myself to put some more work into TTs. My current muscle aches provide evidence that Fabian Cancellara's massive glutes have contributed greatly to his success.

Saturday, July 11, 2009

TdF Stage 8

I do love a small group sprint, and today Luis Leon Sanchez made it look easy. He waited form Casar to do most of the work to bring Efimkin back, closed the gap himself with a few pedal strokes, then paused and let Casar come around to lead him out. He glanced over his right shoulder as if he was giving Casar permission to go, then came around him easily for the win.


I hung around to watch the Versus interviews this morning. They really need to give George Hincapie a while to recover before doing post-stage interviews. Let him have something to drink, maybe some food to get some glucose back in his brain. Ambushing him while non-functional just isn't fair. Then Thor Hushovd had trouble getting his massive Viking hands through the tiny bike-racer sleeves on that green jersey.


Johan Bruyneel claims confusion at the early attack from Cadel Evans. Don't play coy with us, you Belgian minx! Everyone knows you are the evil genius of le Tour, the puppetmaster who controls all.


Oscar Pereiro apparently gave up today. Is his career Beloking?

Friday, July 10, 2009

TdF Stage 7

Fantastic win by Brice Feillu as France takes first and second on a mountaintop finish. Cue the "Is this what a clean Tour looks like?" speculation. It's another great result for France and a big day for Feillu's title sponsor, le ribcage.


In GC news, so concludes the Great Astana Leadership Drama of 2009. Contador now leads Armstrong and I doubt that is going to change. Armstrong should race for second, donate millions to the UCI anti-doping program, and maybe have a longshot chance for an eight Tour win as we head into fall. Leipheimer looked more comfortable than I expected, and Evans continues to loosen up his style nicely. Andy Schleck was disappointing; I expected him to follow Contador but he couldn't even drop his fat brother. And how about track star Bradley Wiggins climbing with the GC contenders and attacking in the final kilometer? Suspicalicious!

Thursday, July 9, 2009

TdF Stage 6

Over 20 riders crashed in today's stage. That looked far more dangerous than the TTT; I wonder who will be the first rider to call for canceling races when it rains. Angry about being left out, René Haselbacher crashed at the Tour of Austria.


The UCI
sorta promises next-day turnover for doping results. This could be a problem, since it doesn't allow much time to leak the positives to L'Equipe.


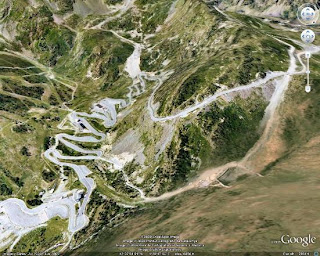
Tomorrow ends with a bit of switchbacky goodness:


Hard for me to see anyone other than Contador winning.

Wednesday, July 8, 2009

TdF Stage 5

Well done, Mr Voeckler! I wonder how many other people didn't know he had never won a TdF stage. Maybe he was given an honorary win at some point.


I agree with whiny Rolf Aldag. If you're sending a team to the Tour, it only makes sense to try winning a stage.


And finally, Bradley Wiggins is saying:

[T]here are so many different levels at this Tour: there are 100 blokes who are good and 100 blokes who are not so good, and it's all mixed up.
Is he saying it's a peloton at two speeds, and he's in the fast group? My goodness, that team is suspicious.

TdF Stage 4

In general, team time trials are only slightly less boring to watch than individual time trials (unless Rasmussen is involved). But this was pretty interesting. Two points:

  • I think bike handling is a respectable skill and should be rewarded. I was happy to see Paris-Roubaix decided by bike handling and I don't mind it being part of the Tour.

  • Garmin had four guys working for the majority of the race, compared to almost twice that many for most teams. And yet they beat almost everyone, finishing second by only 18 seconds. That's an amazing effort. One might even say superhuman!

Lance Armstrong

It is currently my intention that this is going to be a cycling blog, mostly related to pro cycling. I think it is customary to first address every cycling fan's primary question: what do I think about Lance Armstrong? Why, thanks for asking.

I don't particularly like or dislike Lance Armstrong. I have been following cycling closely since 2000, when I started racing with some friends. The crowd I rode with were somewhat ambivalent about Armstrong. They appreciated his Tour successes but as members of a somewhat snobbish niche community they tended to maintain their loyalties to the European stars who were unknown in the United States (Pantani, Jalabert, etc). My personal favorites have been attackers who make races exciting, like Jens Voigt and Ludo Dierckxsens. Armstrong's Tour years were long stretches of predictability punctuated by the occasional fireworks. So I guess he's ok.


I've never been especially bothered by pros who dope. I'm amused to see cheaters get caught, but I've never seen any reason to get angry about something as inconsequential as a pro bike race. However, since I work in biotech and race on the weekends, I am interested in what's behind pro performances. I'm particularly curious about the balance between genetic and therapeutic contributions to a racer's success and, in this respect, there is no greater curiosity than Mr Lance Armstrong.


Armstrong's Personality


Before I get into the doping issues, let me state that everything I've read and seen about Lance Armstrong suggests he is a jerk. He's an ass to his competition and a prick to anyone who criticizes him. But he's a hell of a bike racer. The quintessential Armstrong race was the famous "no gifts" Stage 17 of the 2004 Tour de France into Le Grand Bornand. He used his highly paid (and probably doped) teammates to fragment the field and chase down the struggling break. He offered a half-assed effort to help a teammate win the stage, but when that looked unlikely he unleashed a perfectly-timed, ferocious sprint to chase down and beat Andreas Kloeden, an accomplished rider who had never won a Tour stage. It was an incredible performance, and one motivated by his desire to punish German fans for their crude behavior against him the previous day (Kloeden was riding in the German national champion's jersey). Armstrong's tender sensibilities were further exhibited in a post-race interview, when he explained that he had "given gifts in the Tour de France and very rarely has it ever come back to help [him]." This prickly egoism can be hard to take from a guy who is dominating the Tour for the sixth time. But that was one of the most exciting finishes I've ever seen, so at the end of the day I don't really mind Armstrong's comments or his motivation. It was a great bike race.


Many contrarian types also criticize Armstrong for his personal life and his LiveStrong organization, but I'm not interested in Armstrong's personality or hero status here. He's just a guy who rides a bike fast.


Armstrong's Genetics

It has been said that Armstrong’s physiology is maybe above average for an athlete but nothing beyond past Tour champions. According to the blood test values he has recently released, his level of success wasn’t due to a naturally astronomical hematocrit that let him race above 50%. Neither was it his V02 max, which reportedly peaked around 82-84 ml/kg/min – elite but below Indurain and Lemond’s values of 88 and 92.5 ml/kg/min, respectively. The one extraordinary number that constantly appears in discussions of Armstrong’s physiology is his low lactic acid production. It has been reported that during anaerobic efforts his lactic acid production is one-third to one-half the normal rate. Since lactic acid is thought to cause muscle pain and fatigue during intense efforts, it is often stated that Armstrong’s advantage is that he does not feel the pain that others do and he can therefore push harder. That sounds reasonable, but I wonder if there is more to it than that. Lactic acid is not primarily a fatigue-signaling molecule; it is an irritating waste product of fermentation and accumulates during anaerobic conditions. So if Armstrong’s muscles either do not producing lactic acid at a normal rate or somehow remove lactic acid during anaerobic efforts, his metabolism must be abnormal. So Lance Armstrong might have a genetic metabolic disorder that allows his muscles to strangely create lots of energy around lactate threshold. This is pure speculation -- the type of speculation that a geneticist engages in when considering a seven-time Tour winner, because a geneticist is fascinated by freaks of nature.


Armstrong's Therapeutics


There have literally been books written about whether Lance Armstrong doped his way to seven Tour victories. Since there is plenty of evidence that his competition doped, a common Armstrong defense is that the playing field was level. That is a reasonable position if you're willing to concede that he doped, but just makes the question all the more fascinating to me: was Armstrong clean when he beat them?

David Walsh certainly doesn't think so. He has made a career of making doping allegations against Armstrong. He has a mountain of circumstantial evidence but has never produced anything I find conclusive. While I'm convinced that there was doping on US Postal, most of the strong evidence I've read addresses the pre-Armstrong years or Armstrong's teammates.

There is some evidence that Armstrong used synthetic EPO based on his hematocrit readings. According to a
Bicycling article about Dr Michele Ferrari, Armstrong was recorded to have a maximum hematocrit of 47%. It's not clear to me when these values were taken; it might have been prior to Armstrong's cancer. Recently released data on Armstrong's current (2009) blood values show a maximum hematocrit of 43%. I don't know if this sort of variation can be achieved without doping, but it does suggest that Armstrong rode with a higher than natural hematocrit. However, to Armstrong's credit, the same article mentions that US Postal teammate and fellow Ferrari client Kevin Livingston's hematocrit was 49.9%, just below the UCI limit of 50%. If Ferrari was also doping Armstrong, why would he max out at 47%?

The real proof of Armstrong's doping would be a failed drug test, but unfortunately the major positive result is mired in uncertainty. In 2005, synthetic EPO was found in at least six of Armstrong's blood samples from the 1999 Tour. This finding was described in detail in an interview with
Dr Michael Ashenden on Velocity Nation. A group of researchers was trying to develop detection methods for synthetic EPO in athlete's urine. They needed a training set for the tests; that is, a group of blood samples in which some were known to have synthetic EPO. They chose Tour de France samples from 1999. It isn't clear to me why they didn't use medical samples from anemia patients who had definitely been treated with synthetic EPO. Instead they made the assumption that there must have been doping during the 1999 Tour and thus there would be positives. From a scientific standpoint, this is a very questionable study design. A positive control should, by definition, consist of fully specified and characterized samples, not mysterious samples paired with the assumption of guilty athletes. It is obvious that if you are tuning your test until you recover a positive result (which is what you do with a positive control) you will get a positive result. Without a proper positive control, there really isn't any way to determine if the test was properly tuned. This makes the study findings very difficult to interpret. However, one might argue that if the analysis was producing random noise, it is very unlikely that so many of Armstrong's samples (6 out of 15) would test positive. This compares to 13 positives in a total of 87 samples, and according to my math the likelihood that Armstrong would have so many positives in random data is 1 in 120. So even if the study was poorly designed, over a third of Armstrong's samples were positive whereas only 10% of the other samples were. That is a pretty powerful argument and I'm almost convinced. However, Ashenden then overplays his hand by claiming that the only possibilities are that Armstrong doped or the samples were deliberately tainted by laboratory personnel. But this just begs the question of having a controlled experiment; Ashenden shouldn't rule out other possibilities because the researchers weren't controlling for other, possibly unknown, variables that might be correlated with Armstrong's samples. So while these arguments support the hypothesis that Armstrong doped in the 1999 Tour, I don't think this hypothesis has been validated to scientific or legal standards.

As a minor point, Ashenden claims it was impossible for the labs to know whose samples they were testing. Given the UCI and French anti-doping lab's long history of leaking doping positives to L'Equipe, I am not convinced that the information barriers Ashenden claims exist between these entities are always respected. So I do not share his complete trust in the competence and ethics of these labs.


Nevertheless, the study is the best Armstrong-related doping evidence and Ashenden deserves credit for taking the effort to explain it. Unfortunately Ashenden and his interviewer Andy Shen don't stop there. Shen bizarrely asserts that Armstrong is far shorter than advertised, and stands only 5'5" or 5'6" tall. Ashenden later claims Armstrong weighed over 74 kg (163 lbs) when he was winning the Tour. This data corresponds to a BMI of at least 26. This is officially considered "overweight" by the NIH. I understand the NIH standards apply poorly to muscular builds, but pro bike racers are built like the skeletons of ballerinas. I am 6'1" and 158 lbs (BMI 21) and look like a gluttonous hulk when standing next to one of our local pros. So I am supposed to believe that Lance Armstrong won the world's hardest bike race with a BMI of 26, and furthermore that this means I should question Armstrong's credibility? This is not terribly convincing. In fact, it is extremely weird.


Speculation on Armstrong's weight is primarily introduced to make the case that his post-cancer transformation into a grand tour champion was a result of doping. This is speculative ground, but relevant in light of a common counter-argument based on a study by Ed Coyle. The Coyle study claimed novel physiological changes brought about by Armstrong's specialized training enabled him to transition from a single-day racer to a grand tour winner. I think Ashenden convincingly refutes most of this study, allowing the possibility for other theories. Ashenden's personal theory is that Armstrong doped. It essentially comes down to the contention that Armstrong lied about his weight (of course he did; every professional athlete lies about their weight). Ashenden is particularly keen to show that Armstrong's post-cancer weight loss was a lie (and an illusion for those of us who have seen pre- and post-cancer video footage). He tries to refute Armstrong's claim that he weighted 72 kg during his Tour wins by quoting Coyle's measurement of 79 kilograms for Armstrong's weight in November 1999. According to Ashenden, Armstrong wouldn't allow himself to gain so much weight between races, so clearly Armstrong was not as low as 72 kg during the Tour in July. This is neither a evidence-based nor convincing assertion. November is the heart of the off-season for a cyclist who concentrates on July, and it is not unheard of for pro (and amateur) cyclists to gain significant weight during the fall and burn it off during daily 5-hour training rides in the winter and spring. Ashenden then asserts that because Armstrong admitted under oath to a race weight of 74 kg, he really must have weighed more than that. There is no evidence to support this hunch. I think the best one can say here is that we don't know how much Armstrong actually weighed, at any time during his career. Which means one can't draw any conclusions about how big a role weight loss played in Armstrong's Tour success.


Ashenden also uses Tour de France time trial results to measure Armstrong's pre and post cancer performance gains. I think it is common knowledge that riders without an interest in the overall classification of a grand tour often do not put a full effort into the time trial stages. These riders lose hours over the mountains stages; losing ten more minutes in the time trials is nothing if one can save their energy for a chance at a stage win down the road. Before cancer Armstrong was riding for stage wins and after cancer he was riding for the overall, so judging his differences in fitness by time trials is inconclusive and kind of silly.


Finally, my greatest objection to the argument that doping transformed Armstrong into a Tour winner is that it implies pre-cancer Armstrong was a clean, or at least cleaner, racer (otherwise he would have won the Tour earlier). Personally I think this is highly dubious. Armstrong was the number one ranked cyclist in the world at age 21, in an era famous for rampant doping in pro cycling. He won the prestigious World Championships Road Race by riding away from a peloton of the world's best dopers to cross the line alone. Frankly, I would be shocked to learn Armstrong wasn't doping at that time. If Lance Armstrong was clean in 1993 then his cycling gifts are truly awesome, and I have no problem believing every one of his Tour wins were the product of a new post-cancer focus with no drugs involved. Alternatively, if he was doping prior to cancer, drugs alone won't explain the later Tour success. One could split hairs and make the argument that he was doping back then, but after cancer his doping practices were re-focused on the Tour and greatly intensified. Sure, maybe. But I don't see how you can make this argument with numbers, as per Ashenden; you are left with comparing one set of performance metrics clouded by the effects of doping with another set of performance metrics clouded by doping. One can only isolate the effects of doping by comparing a non-doped Armstrong with a doped Armstrong, and I'm not convinced anyone has this data.


So did he or didn't he?


If I had to make a call, I would ignorantly guess that Armstrong doped during his Tour victories. I'm still fascinated by the idea that he harbors a very rare and advantageous genetic makeup, but that just seems less probable. The best I can hope for is that he is able to contend for overall victory at this year's Tour and he continues to release his blood values while he does it. If he can win the Tour at age 37 with a hematocrit of 43%, he might just be the freak he claims he is.